
BEACON is an open Cloudflare dataset of billions of real-user page performance measurements, and the finding that changes the most for anyone optimizing speed is this: on pages with poor LCP, the cost is discovering the main element and unblocking its render, not downloading the image. Cloudflare published the dataset on September 28, 2026, on the company blog, with daily updates in Google BigQuery.
For SEO decision makers, the gain is full Core Web Vitals (the loading, stability and responsiveness metrics Google measures) histograms at public scale, not just the P75 that the Search Console report shows.
What is Cloudflare BEACON?
BEACON stands for Browser Experience Across Cloudflare’s Observed Network. It is an anonymized Real User Monitoring (RUM) dataset from 10,000 of the largest sites on Cloudflare’s network, covering every major browser engine. It follows the RUM Archive standard, a public RUM database, and Cloudflare says it expands that project’s footprint 100-fold.
All three Core Web Vitals are there: LCP (loading), CLS (visual stability) and INP (interaction responsiveness). The difference is that they come as histograms. You can compute P90 or P95 and look at the long tail, where the users that averages hide live.
On privacy, Cloudflare strips domains and URL paths, aggregates records by country, operating system, browser and protocol, and discards any aggregate with fewer than five records.
Who gets the slowest web?
iOS, which today runs only the WebKit engine, performs best overall on Core Web Vitals, but the advantage is not universal. In 46 countries where WebKit has more than 10% of traffic, its LCP, INP or both are at least 10% worse than Blink-based browsers such as Chrome, Edge and Opera. In Cambodia, WebKit accounts for 17.5% of page views and its LCP is 50% worse than Blink’s.
By industry, Cloudflare uses the domain classification from its Intel API. Government and Politics, Health and Safe for Kids rank among the best. Ads, Religion and Weather rank among the worst. At higher percentiles, visual stability (CLS) drops sharply in several industries, something P75 alone does not show.
What actually makes a page slow?
LCP discovery delay and render delay weigh more than the file download. Cloudflare split LCP into four sub-parts and showed the values by rating bucket:
| LCP sub-part | Good | Needs Improvement | Poor |
|---|---|---|---|
| Document TTFB (HTML arrives) | 598 ms | 1015 ms | 1891 ms |
| Load Delay (element discovery) | 76 ms | 1049 ms | 1485 ms |
| Load Duration (download) | 119 ms | 199 ms | 119 ms |
| Render Delay (render blocking) | 157 ms | 437 ms | 2002 ms |
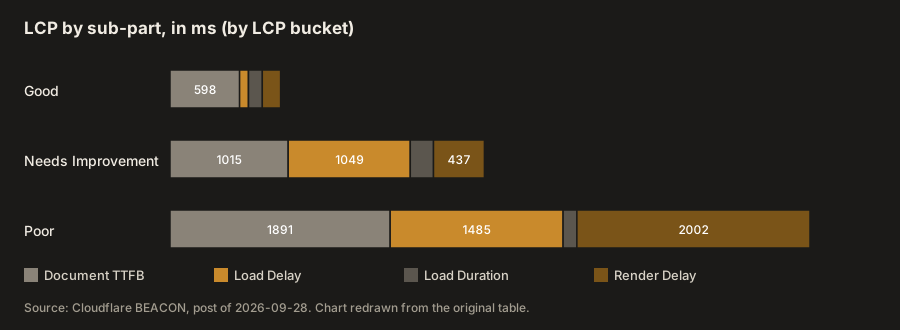
Cloudflare’s own reading is that downloading the image, font or video is usually the part that contributes least. In the Poor bucket, Render Delay reaches 2002 ms and Load Delay 1485 ms, against 119 ms of Load Duration.
INP follows the same logic, with three sub-parts:
| INP sub-part | Good | Needs Improvement | Poor |
|---|---|---|---|
| Input Delay (busy main thread) | 18 ms | 32 ms | 84 ms |
| Processing Time (interaction JavaScript) | 55 ms | 112 ms | 284 ms |
| Presentation Delay (painting the update) | 56 ms | 111 ms | 217 ms |
On the slowest interactions, JavaScript execution takes the longest stretch, but presentation time also climbs significantly, usually because of complex CSS layout recalculation.
In practice, this reorders the checklist. Before compressing one more image, find out whether the LCP element is discovered early (JavaScript dependence delays that) and whether something blocks its render. Cloudflare customers can address part of the discovery delay with Smart Hints, and Zaraz helps reduce the weight of third-party JavaScript, according to the company.
Are SPA navigations really faster?
Almost always, after the first page. With support for Chrome’s Soft Navigations API, Cloudflare now measures LCP on client-side navigations, common in React, Vue, Angular and Svelte apps. The Blink values:
| LCP percentile | P50 | P75 | P90 | P95 |
|---|---|---|---|---|
| Hard navigation | 791 ms | 1,421 ms | 2,636 ms | 4,122 ms |
| Soft navigation | 274 ms | 582 ms | 1,169 ms | 1,816 ms |
| Landing page | 1,370 ms | 2,681 ms | 5,397 ms | 8,940 ms |
Soft navigation renders two to three times faster than hard navigation at every percentile. But the landing page, which tends to be much heavier, has a P95 of 8,940 ms. If visitors rarely go past the first page, as with many blogs and local service sites, a heavy initial load may never pay for itself. Organic search visitors almost always arrive on a landing page, so that is the number SEO feels first.
I have worked in SEO since 2014 and have seen plenty of projects switch frameworks to “gain speed” and make the first visit worse. Measure the landing page before you decide.
What does BEACON show about networks and country economies?
Cloudflare joined BEACON with World Bank GDP per capita and with the Internet Quality Index (IQI) from Cloudflare Radar. The general pattern is expected: more bandwidth, better LCP. The surprise came from transfer size. In Africa, users download less data per page, which suggests sites are adapted to constrained networks, although Cloudflare warns the cause cannot be confirmed. A good network can also forgive a poorly optimized site, and a slow one amplifies bottlenecks. The company will launch a Web Performance section on Radar with these correlations.
How do you use BEACON in your SEO work?
The dataset lives in Google BigQuery, and Cloudflare saved the queries for every table in the post there, with names like “Global LCP Sub-parts”, “Global INP Sub-parts” and “CWVs by Industry”. You can adapt each one.
What to do on Monday:
- Open the Core Web Vitals report in Search Console and separate URLs into Poor and Needs Improvement.
- For each one, find the dominant LCP sub-part: slow HTML, late element discovery, or blocked rendering.
- Compare your P75 with your industry’s range in the BEACON queries, instead of the global average.
- On SPA sites, measure the landing page separately from internal navigations.
Summary: what to take from BEACON
- BEACON is public, daily and has full LCP, CLS and INP histograms, not just P75.
- On pages with poor LCP, Load Delay and Render Delay add up to far more time than the resource download.
- On slow INP, JavaScript weighs most, but presentation time also climbs.
- SPA soft navigation is two to three times faster, but the landing page reaches 8,940 ms at P95.
- WebKit is the best overall, but in 46 countries it trails Blink by at least 10% on LCP, INP or both.
To see how these numbers feed into rankings, read the guide to Core Web Vitals in SEO. If your question is the other side of Cloudflare, see how to block AI training without disappearing from Google. And for images that slow a page down, the piece on images for SEO and page loading still holds.